

PUMA User's Manual

|
|
|
I. Introduction
Figure I.1 Where l is the wavelength
of the light beam, e the spacing between the 2 plates, n the refractive
index of the medium and i the inclination of the beam.
I.2. Definitions
and basic (but useful) formulae
The luminous intensity transmitted is given by:
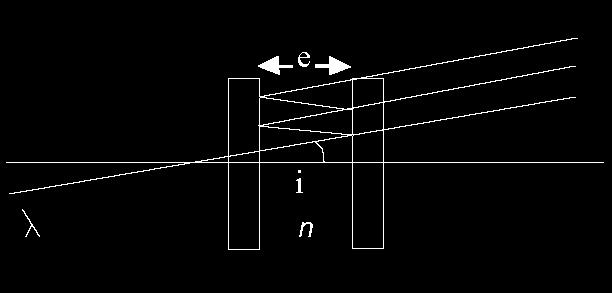
Figure I.2 Airy function for different finesse
I.3. The scanning Fabry PerotIn a scanning FP, the spacing e between the 2 plates is not constant anymore. The etalon will act like a turnable filter scanning along the Free Spectral Range. The figure I.3 is giving an excellent illustration of how the scanning FP produces a profile in each pixel of the receptor (Georgelin Y.P. in CFHT MOS/SIS User Manual).

Figure I.3 How a Scanning FP produce profiles
The FP will scan across all the free spectral range with a step given by: nb of channel ~ 2*Finesse. At the end we will deal with a data cube: x, y and the spacing e who is related to the wavelength. Through the Doppler relationship the wavelength can be related to the velocity.